Sp-snR69b-sno
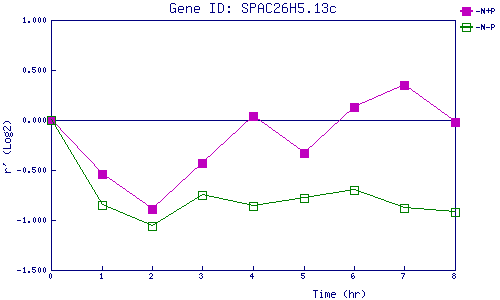
| 0 | 1 | 2 | 3 | 4 | 5 | 6 | 7 | 8 | |
| -N+P | 0.000 | -0.544 | -0.894 | -0.427 | 0.039 | -0.326 | 0.131 | 0.350 | -0.015 |
| -N-P | 0.000 | -0.850 | -1.064 | -0.753 | -0.862 | -0.777 | -0.700 | -0.879 | -0.919 |
|
-N+P: Nitrogen starved in the presence of P-factor -N-P: Nitrogen starved in the absence of P-factor |