apc14 omt1
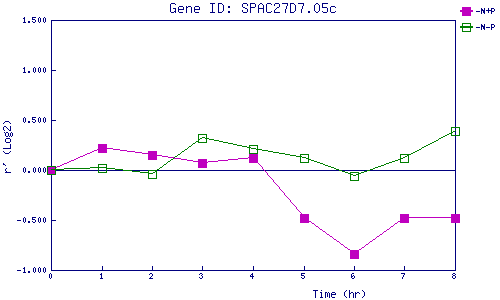
| 0 | 1 | 2 | 3 | 4 | 5 | 6 | 7 | 8 | |
| -N+P | 0.000 | 0.215 | 0.146 | 0.066 | 0.117 | -0.485 | -0.836 | -0.477 | -0.477 |
| -N-P | 0.000 | 0.024 | -0.041 | 0.325 | 0.210 | 0.116 | -0.058 | 0.119 | 0.389 |
|
-N+P: Nitrogen starved in the presence of P-factor -N-P: Nitrogen starved in the absence of P-factor |