| 0 | 1 | 2 | 3 | 4 | 5 | 6 | 7 | 8 | |
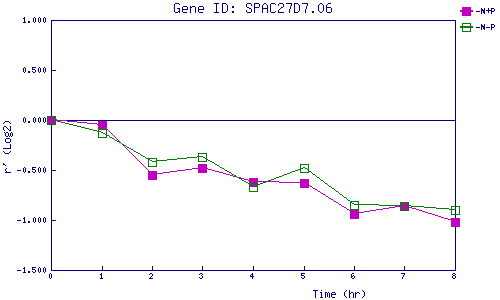
| -N+P | 0.000 | -0.047 | -0.551 | -0.478 | -0.621 | -0.631 | -0.942 | -0.863 | -1.016 |
| -N-P | 0.000 | -0.127 | -0.416 | -0.373 | -0.674 | -0.485 | -0.850 | -0.865 | -0.898 |
|
-N+P: Nitrogen starved in the presence of P-factor -N-P: Nitrogen starved in the absence of P-factor |