smd1
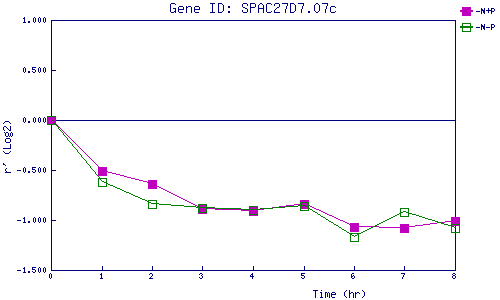
| 0 | 1 | 2 | 3 | 4 | 5 | 6 | 7 | 8 | |
| -N+P | 0.000 | -0.511 | -0.635 | -0.887 | -0.914 | -0.836 | -1.067 | -1.080 | -1.009 |
| -N-P | 0.000 | -0.617 | -0.842 | -0.875 | -0.903 | -0.865 | -1.174 | -0.918 | -1.080 |
|
-N+P: Nitrogen starved in the presence of P-factor -N-P: Nitrogen starved in the absence of P-factor |