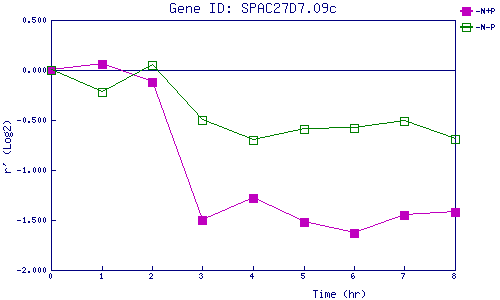
| 0 | 1 | 2 | 3 | 4 | 5 | 6 | 7 | 8 | |
| -N+P | 0.000 | 0.065 | -0.115 | -1.496 | -1.281 | -1.519 | -1.626 | -1.453 | -1.424 |
| -N-P | 0.000 | -0.225 | 0.054 | -0.500 | -0.702 | -0.587 | -0.578 | -0.510 | -0.690 |
|
-N+P: Nitrogen starved in the presence of P-factor -N-P: Nitrogen starved in the absence of P-factor |