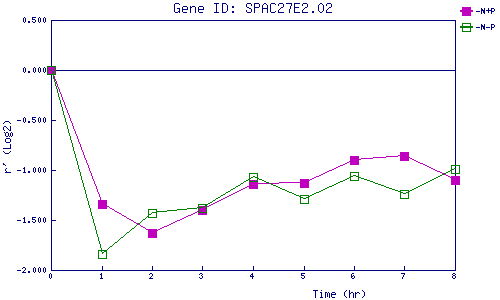
| 0 | 1 | 2 | 3 | 4 | 5 | 6 | 7 | 8 | |
| -N+P | 0.000 | -1.335 | -1.629 | -1.399 | -1.136 | -1.131 | -0.903 | -0.862 | -1.103 |
| -N-P | 0.000 | -1.838 | -1.427 | -1.384 | -1.071 | -1.291 | -1.065 | -1.239 | -0.991 |
|
-N+P: Nitrogen starved in the presence of P-factor -N-P: Nitrogen starved in the absence of P-factor |