prl53 prl63 prl49
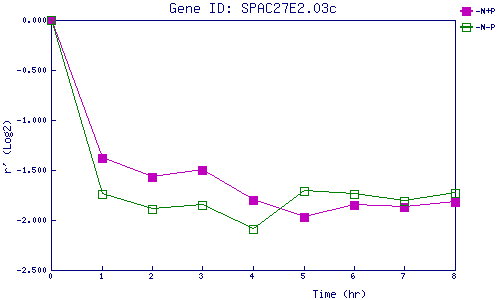
| 0 | 1 | 2 | 3 | 4 | 5 | 6 | 7 | 8 | |
| -N+P | 0.000 | -1.378 | -1.574 | -1.497 | -1.795 | -1.974 | -1.849 | -1.874 | -1.825 |
| -N-P | 0.000 | -1.738 | -1.890 | -1.851 | -2.094 | -1.706 | -1.736 | -1.807 | -1.731 |
|
-N+P: Nitrogen starved in the presence of P-factor -N-P: Nitrogen starved in the absence of P-factor |