cdc1 mis1
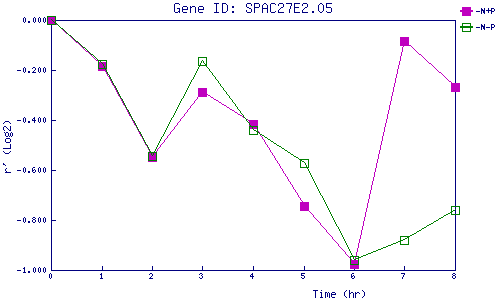
| 0 | 1 | 2 | 3 | 4 | 5 | 6 | 7 | 8 | |
| -N+P | 0.000 | -0.185 | -0.549 | -0.290 | -0.414 | -0.746 | -0.978 | -0.085 | -0.269 |
| -N-P | 0.000 | -0.175 | -0.543 | -0.163 | -0.440 | -0.571 | -0.962 | -0.881 | -0.761 |
|
-N+P: Nitrogen starved in the presence of P-factor -N-P: Nitrogen starved in the absence of P-factor |