cdc8 fus4
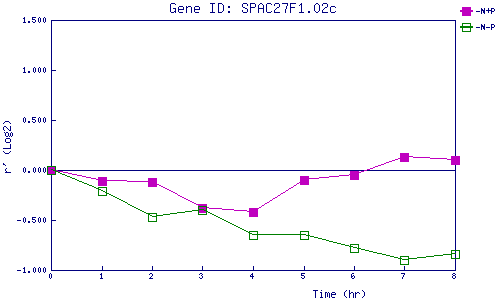
| 0 | 1 | 2 | 3 | 4 | 5 | 6 | 7 | 8 | |
| -N+P | 0.000 | -0.113 | -0.115 | -0.379 | -0.425 | -0.098 | -0.046 | 0.130 | 0.095 |
| -N-P | 0.000 | -0.211 | -0.473 | -0.404 | -0.647 | -0.652 | -0.778 | -0.898 | -0.843 |
|
-N+P: Nitrogen starved in the presence of P-factor -N-P: Nitrogen starved in the absence of P-factor |