nuf2
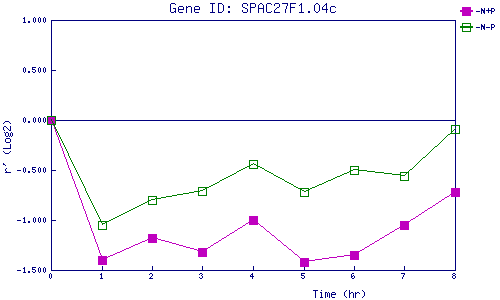
| 0 | 1 | 2 | 3 | 4 | 5 | 6 | 7 | 8 | |
| -N+P | 0.000 | -1.395 | -1.178 | -1.325 | -0.995 | -1.416 | -1.351 | -1.053 | -0.720 |
| -N-P | 0.000 | -1.046 | -0.796 | -0.712 | -0.443 | -0.723 | -0.503 | -0.558 | -0.094 |
|
-N+P: Nitrogen starved in the presence of P-factor -N-P: Nitrogen starved in the absence of P-factor |