| 0 | 1 | 2 | 3 | 4 | 5 | 6 | 7 | 8 | |
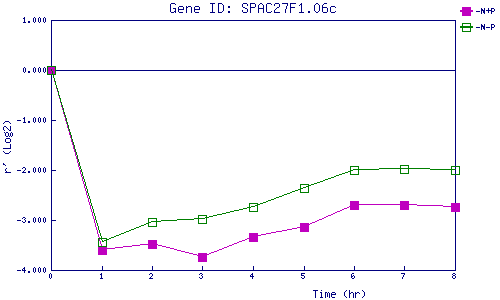
| -N+P | 0.000 | -3.606 | -3.488 | -3.738 | -3.334 | -3.138 | -2.701 | -2.700 | -2.741 |
| -N-P | 0.000 | -3.450 | -3.032 | -2.987 | -2.745 | -2.366 | -1.994 | -1.986 | -2.007 |
|
-N+P: Nitrogen starved in the presence of P-factor -N-P: Nitrogen starved in the absence of P-factor |