| 0 | 1 | 2 | 3 | 4 | 5 | 6 | 7 | 8 | |
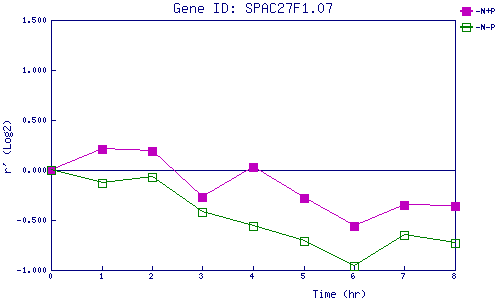
| -N+P | 0.000 | 0.210 | 0.190 | -0.270 | 0.032 | -0.278 | -0.555 | -0.350 | -0.355 |
| -N-P | 0.000 | -0.129 | -0.067 | -0.425 | -0.563 | -0.714 | -0.962 | -0.652 | -0.732 |
|
-N+P: Nitrogen starved in the presence of P-factor -N-P: Nitrogen starved in the absence of P-factor |