prp10 sap155
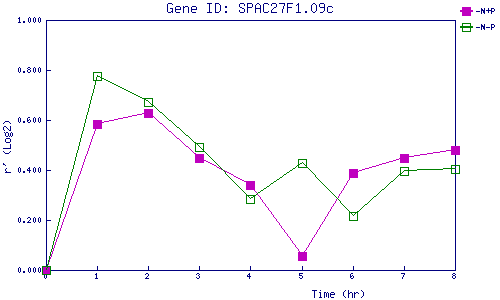
| 0 | 1 | 2 | 3 | 4 | 5 | 6 | 7 | 8 | |
| -N+P | 0.000 | 0.583 | 0.629 | 0.449 | 0.341 | 0.055 | 0.389 | 0.446 | 0.480 |
| -N-P | 0.000 | 0.777 | 0.670 | 0.492 | 0.284 | 0.427 | 0.215 | 0.395 | 0.403 |
|
-N+P: Nitrogen starved in the presence of P-factor -N-P: Nitrogen starved in the absence of P-factor |