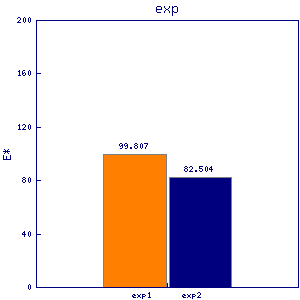
tef3
| 0 | 1 | 2 | 3 | 4 | 5 | 6 | 7 | 8 | |
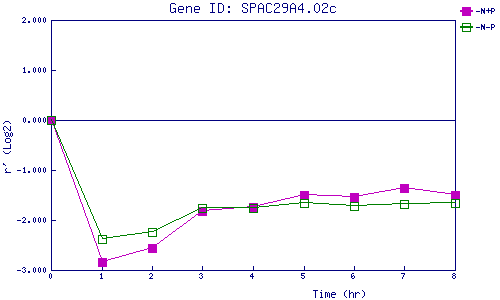
| -N+P | 0.000 | -2.850 | -2.550 | -1.821 | -1.748 | -1.503 | -1.548 | -1.364 | -1.507 |
| -N-P | 0.000 | -2.373 | -2.243 | -1.751 | -1.759 | -1.662 | -1.719 | -1.687 | -1.664 |
|
-N+P: Nitrogen starved in the presence of P-factor -N-P: Nitrogen starved in the absence of P-factor |