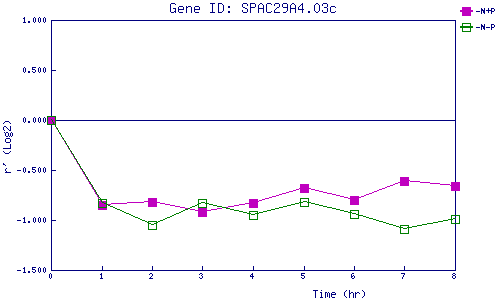
| 0 | 1 | 2 | 3 | 4 | 5 | 6 | 7 | 8 | |
| -N+P | 0.000 | -0.852 | -0.825 | -0.923 | -0.830 | -0.677 | -0.799 | -0.607 | -0.659 |
| -N-P | 0.000 | -0.826 | -1.048 | -0.830 | -0.948 | -0.821 | -0.943 | -1.094 | -0.987 |
|
-N+P: Nitrogen starved in the presence of P-factor -N-P: Nitrogen starved in the absence of P-factor |