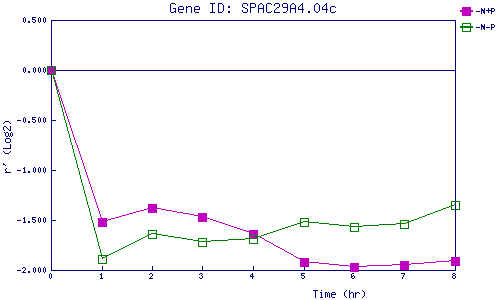
| 0 | 1 | 2 | 3 | 4 | 5 | 6 | 7 | 8 | |
| -N+P | 0.000 | -1.523 | -1.382 | -1.472 | -1.644 | -1.924 | -1.966 | -1.953 | -1.914 |
| -N-P | 0.000 | -1.890 | -1.635 | -1.723 | -1.689 | -1.519 | -1.571 | -1.535 | -1.348 |
|
-N+P: Nitrogen starved in the presence of P-factor -N-P: Nitrogen starved in the absence of P-factor |