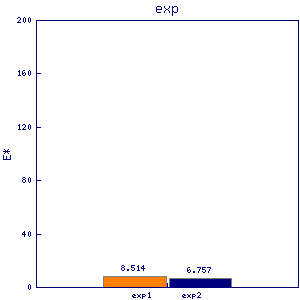
srb6
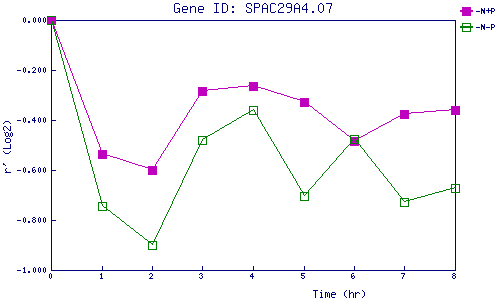
| 0 | 1 | 2 | 3 | 4 | 5 | 6 | 7 | 8 | |
| -N+P | 0.000 | -0.538 | -0.602 | -0.283 | -0.266 | -0.329 | -0.484 | -0.377 | -0.359 |
| -N-P | 0.000 | -0.744 | -0.900 | -0.478 | -0.358 | -0.705 | -0.476 | -0.729 | -0.672 |
|
-N+P: Nitrogen starved in the presence of P-factor -N-P: Nitrogen starved in the absence of P-factor |