prp19 cwf8
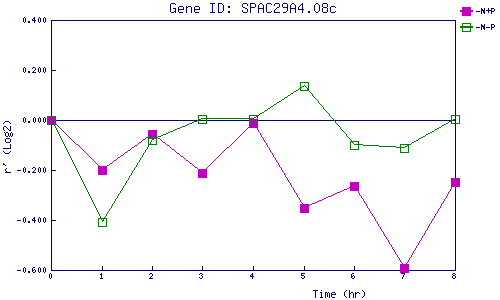
| 0 | 1 | 2 | 3 | 4 | 5 | 6 | 7 | 8 | |
| -N+P | 0.000 | -0.201 | -0.056 | -0.213 | -0.011 | -0.353 | -0.265 | -0.591 | -0.250 |
| -N-P | 0.000 | -0.409 | -0.080 | 0.005 | 0.005 | 0.135 | -0.099 | -0.111 | 0.003 |
|
-N+P: Nitrogen starved in the presence of P-factor -N-P: Nitrogen starved in the absence of P-factor |