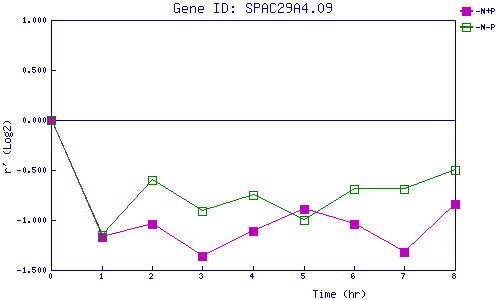
| 0 | 1 | 2 | 3 | 4 | 5 | 6 | 7 | 8 | |
| -N+P | 0.000 | -1.169 | -1.045 | -1.360 | -1.107 | -0.886 | -1.044 | -1.322 | -0.836 |
| -N-P | 0.000 | -1.146 | -0.600 | -0.912 | -0.750 | -0.998 | -0.689 | -0.692 | -0.501 |
|
-N+P: Nitrogen starved in the presence of P-factor -N-P: Nitrogen starved in the absence of P-factor |