rrn5
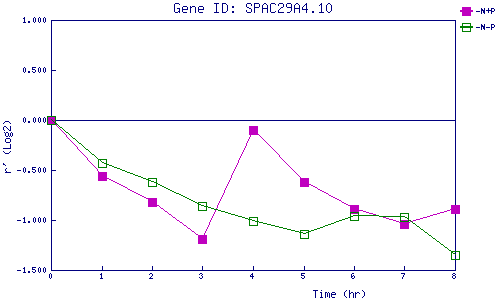
| 0 | 1 | 2 | 3 | 4 | 5 | 6 | 7 | 8 | |
| -N+P | 0.000 | -0.559 | -0.825 | -1.192 | -0.099 | -0.622 | -0.888 | -1.040 | -0.888 |
| -N-P | 0.000 | -0.426 | -0.616 | -0.855 | -1.011 | -1.144 | -0.960 | -0.972 | -1.347 |
|
-N+P: Nitrogen starved in the presence of P-factor -N-P: Nitrogen starved in the absence of P-factor |