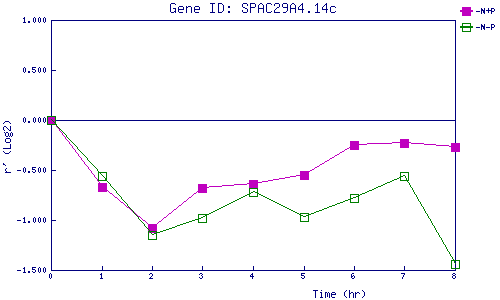
| 0 | 1 | 2 | 3 | 4 | 5 | 6 | 7 | 8 | |
| -N+P | 0.000 | -0.670 | -1.078 | -0.676 | -0.637 | -0.548 | -0.251 | -0.227 | -0.266 |
| -N-P | 0.000 | -0.558 | -1.151 | -0.977 | -0.718 | -0.969 | -0.778 | -0.560 | -1.440 |
|
-N+P: Nitrogen starved in the presence of P-factor -N-P: Nitrogen starved in the absence of P-factor |