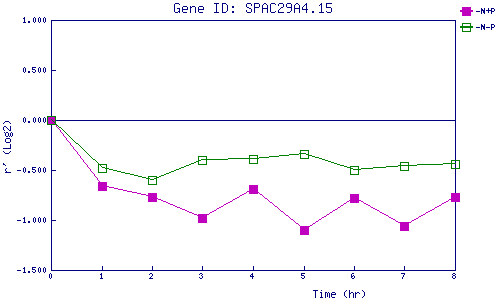
| 0 | 1 | 2 | 3 | 4 | 5 | 6 | 7 | 8 | |
| -N+P | 0.000 | -0.656 | -0.767 | -0.982 | -0.693 | -1.097 | -0.781 | -1.057 | -0.772 |
| -N-P | 0.000 | -0.478 | -0.604 | -0.397 | -0.393 | -0.341 | -0.505 | -0.455 | -0.441 |
|
-N+P: Nitrogen starved in the presence of P-factor -N-P: Nitrogen starved in the absence of P-factor |