| 0 | 1 | 2 | 3 | 4 | 5 | 6 | 7 | 8 | |
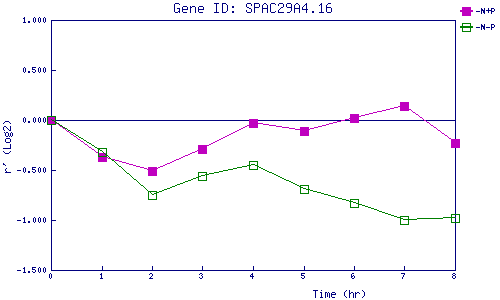
| -N+P | 0.000 | -0.369 | -0.512 | -0.293 | -0.027 | -0.111 | 0.019 | 0.142 | -0.232 |
| -N-P | 0.000 | -0.316 | -0.751 | -0.564 | -0.450 | -0.694 | -0.829 | -1.003 | -0.978 |
|
-N+P: Nitrogen starved in the presence of P-factor -N-P: Nitrogen starved in the absence of P-factor |