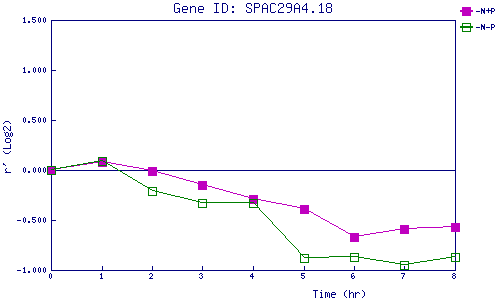
| 0 | 1 | 2 | 3 | 4 | 5 | 6 | 7 | 8 | |
| -N+P | 0.000 | 0.076 | -0.013 | -0.151 | -0.289 | -0.386 | -0.671 | -0.593 | -0.569 |
| -N-P | 0.000 | 0.087 | -0.209 | -0.330 | -0.330 | -0.875 | -0.873 | -0.947 | -0.868 |
|
-N+P: Nitrogen starved in the presence of P-factor -N-P: Nitrogen starved in the absence of P-factor |