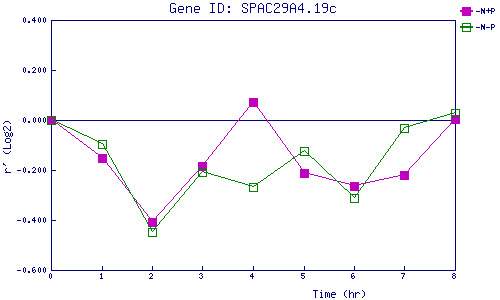
| 0 | 1 | 2 | 3 | 4 | 5 | 6 | 7 | 8 | |
| -N+P | 0.000 | -0.154 | -0.408 | -0.186 | 0.072 | -0.212 | -0.264 | -0.221 | 0.004 |
| -N-P | 0.000 | -0.096 | -0.449 | -0.210 | -0.269 | -0.124 | -0.313 | -0.030 | 0.029 |
|
-N+P: Nitrogen starved in the presence of P-factor -N-P: Nitrogen starved in the absence of P-factor |