| 0 | 1 | 2 | 3 | 4 | 5 | 6 | 7 | 8 | |
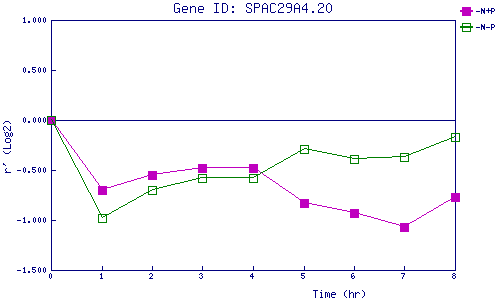
| -N+P | 0.000 | -0.705 | -0.546 | -0.476 | -0.477 | -0.833 | -0.933 | -1.068 | -0.772 |
| -N-P | 0.000 | -0.977 | -0.701 | -0.582 | -0.584 | -0.286 | -0.392 | -0.368 | -0.169 |
|
-N+P: Nitrogen starved in the presence of P-factor -N-P: Nitrogen starved in the absence of P-factor |