rcd1
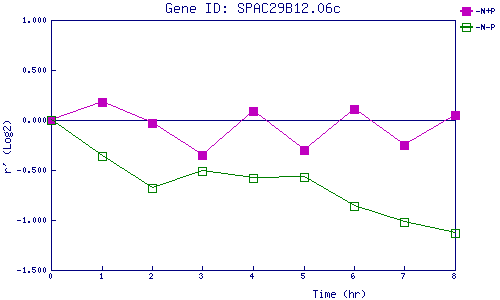
| 0 | 1 | 2 | 3 | 4 | 5 | 6 | 7 | 8 | |
| -N+P | 0.000 | 0.175 | -0.027 | -0.351 | 0.092 | -0.302 | 0.106 | -0.248 | 0.047 |
| -N-P | 0.000 | -0.362 | -0.677 | -0.510 | -0.583 | -0.567 | -0.855 | -1.017 | -1.130 |
|
-N+P: Nitrogen starved in the presence of P-factor -N-P: Nitrogen starved in the absence of P-factor |