tdf1 tbp1 tbp
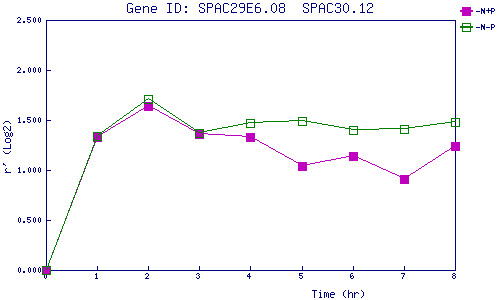
| 0 | 1 | 2 | 3 | 4 | 5 | 6 | 7 | 8 | |
| -N+P | 0.000 | 1.333 | 1.636 | 1.361 | 1.334 | 1.042 | 1.140 | 0.906 | 1.242 |
| -N-P | 0.000 | 1.337 | 1.711 | 1.368 | 1.474 | 1.488 | 1.397 | 1.408 | 1.479 |
|
-N+P: Nitrogen starved in the presence of P-factor -N-P: Nitrogen starved in the absence of P-factor |