smd2 cwf9 SPATRNASER.03 SPATRNAMET.03
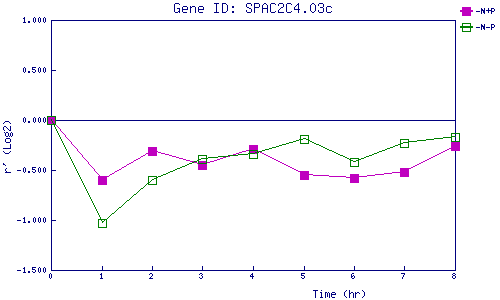
| 0 | 1 | 2 | 3 | 4 | 5 | 6 | 7 | 8 | |
| -N+P | 0.000 | -0.601 | -0.310 | -0.447 | -0.293 | -0.551 | -0.575 | -0.516 | -0.265 |
| -N-P | 0.000 | -1.026 | -0.605 | -0.388 | -0.343 | -0.194 | -0.420 | -0.233 | -0.167 |
|
-N+P: Nitrogen starved in the presence of P-factor -N-P: Nitrogen starved in the absence of P-factor |