| 0 | 1 | 2 | 3 | 4 | 5 | 6 | 7 | 8 | |
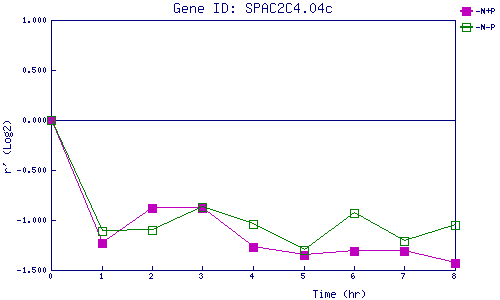
| -N+P | 0.000 | -1.228 | -0.884 | -0.880 | -1.266 | -1.354 | -1.309 | -1.307 | -1.434 |
| -N-P | 0.000 | -1.108 | -1.097 | -0.867 | -1.040 | -1.295 | -0.931 | -1.206 | -1.051 |
|
-N+P: Nitrogen starved in the presence of P-factor -N-P: Nitrogen starved in the absence of P-factor |
