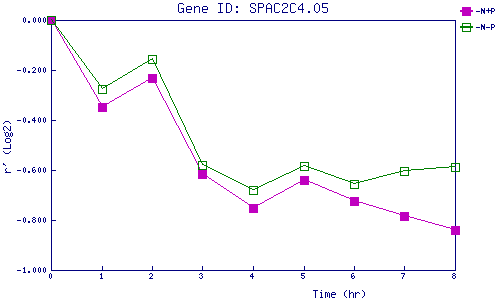
| 0 | 1 | 2 | 3 | 4 | 5 | 6 | 7 | 8 | |
| -N+P | 0.000 | -0.348 | -0.233 | -0.614 | -0.752 | -0.638 | -0.725 | -0.782 | -0.839 |
| -N-P | 0.000 | -0.275 | -0.156 | -0.581 | -0.682 | -0.585 | -0.657 | -0.603 | -0.588 |
|
-N+P: Nitrogen starved in the presence of P-factor -N-P: Nitrogen starved in the absence of P-factor |