| 0 | 1 | 2 | 3 | 4 | 5 | 6 | 7 | 8 | |
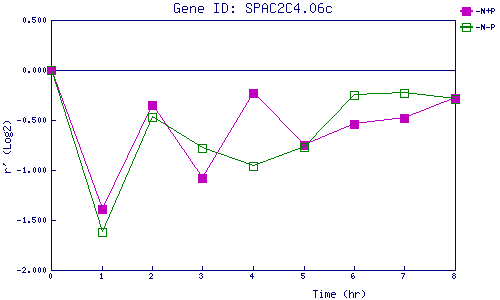
| -N+P | 0.000 | -1.390 | -0.354 | -1.084 | -0.229 | -0.754 | -0.544 | -0.485 | -0.281 |
| -N-P | 0.000 | -1.615 | -0.466 | -0.776 | -0.955 | -0.772 | -0.249 | -0.232 | -0.293 |
|
-N+P: Nitrogen starved in the presence of P-factor -N-P: Nitrogen starved in the absence of P-factor |