| 0 | 1 | 2 | 3 | 4 | 5 | 6 | 7 | 8 | |
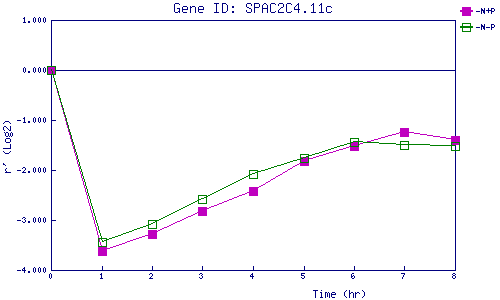
| -N+P | 0.000 | -3.628 | -3.277 | -2.814 | -2.414 | -1.812 | -1.519 | -1.245 | -1.405 |
| -N-P | 0.000 | -3.438 | -3.070 | -2.577 | -2.074 | -1.760 | -1.433 | -1.492 | -1.525 |
|
-N+P: Nitrogen starved in the presence of P-factor -N-P: Nitrogen starved in the absence of P-factor |