| 0 | 1 | 2 | 3 | 4 | 5 | 6 | 7 | 8 | |
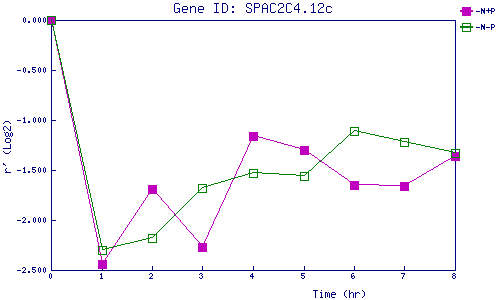
| -N+P | 0.000 | -2.444 | -1.689 | -2.268 | -1.160 | -1.305 | -1.650 | -1.661 | -1.355 |
| -N-P | 0.000 | -2.298 | -2.182 | -1.681 | -1.530 | -1.563 | -1.106 | -1.224 | -1.326 |
|
-N+P: Nitrogen starved in the presence of P-factor -N-P: Nitrogen starved in the absence of P-factor |