vma16
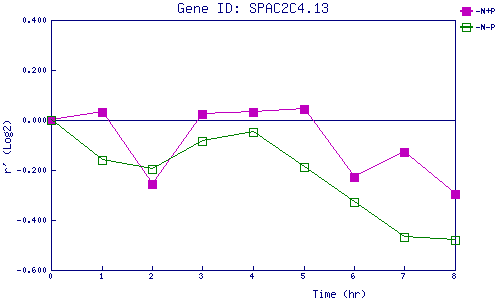
| 0 | 1 | 2 | 3 | 4 | 5 | 6 | 7 | 8 | |
| -N+P | 0.000 | 0.034 | -0.255 | 0.026 | 0.031 | 0.044 | -0.227 | -0.129 | -0.294 |
| -N-P | 0.000 | -0.162 | -0.197 | -0.083 | -0.049 | -0.187 | -0.330 | -0.468 | -0.481 |
|
-N+P: Nitrogen starved in the presence of P-factor -N-P: Nitrogen starved in the absence of P-factor |