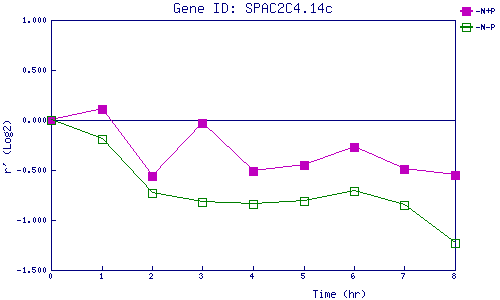
| 0 | 1 | 2 | 3 | 4 | 5 | 6 | 7 | 8 | |
| -N+P | 0.000 | 0.110 | -0.555 | -0.031 | -0.507 | -0.452 | -0.267 | -0.494 | -0.549 |
| -N-P | 0.000 | -0.189 | -0.730 | -0.820 | -0.845 | -0.806 | -0.708 | -0.851 | -1.232 |
|
-N+P: Nitrogen starved in the presence of P-factor -N-P: Nitrogen starved in the absence of P-factor |