rps801 rps8-1
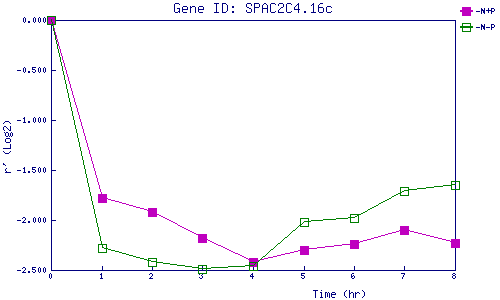
| 0 | 1 | 2 | 3 | 4 | 5 | 6 | 7 | 8 | |
| -N+P | 0.000 | -1.780 | -1.919 | -2.176 | -2.417 | -2.302 | -2.241 | -2.097 | -2.229 |
| -N-P | 0.000 | -2.283 | -2.419 | -2.494 | -2.463 | -2.025 | -1.982 | -1.713 | -1.654 |
|
-N+P: Nitrogen starved in the presence of P-factor -N-P: Nitrogen starved in the absence of P-factor |