| 0 | 1 | 2 | 3 | 4 | 5 | 6 | 7 | 8 | |
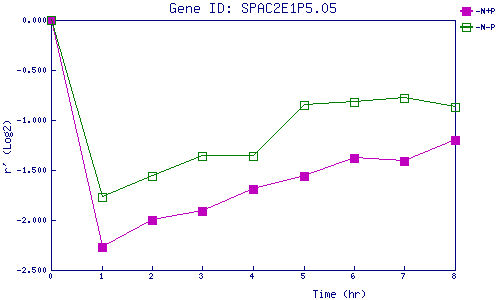
| -N+P | 0.000 | -2.266 | -2.004 | -1.911 | -1.692 | -1.557 | -1.382 | -1.413 | -1.195 |
| -N-P | 0.000 | -1.769 | -1.564 | -1.363 | -1.358 | -0.848 | -0.823 | -0.782 | -0.869 |
|
-N+P: Nitrogen starved in the presence of P-factor -N-P: Nitrogen starved in the absence of P-factor |