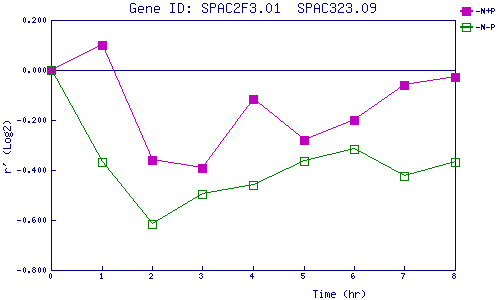
| 0 | 1 | 2 | 3 | 4 | 5 | 6 | 7 | 8 | |
| -N+P | 0.000 | 0.101 | -0.359 | -0.393 | -0.116 | -0.278 | -0.202 | -0.061 | -0.028 |
| -N-P | 0.000 | -0.370 | -0.617 | -0.497 | -0.460 | -0.364 | -0.316 | -0.422 | -0.366 |
|
-N+P: Nitrogen starved in the presence of P-factor -N-P: Nitrogen starved in the absence of P-factor |