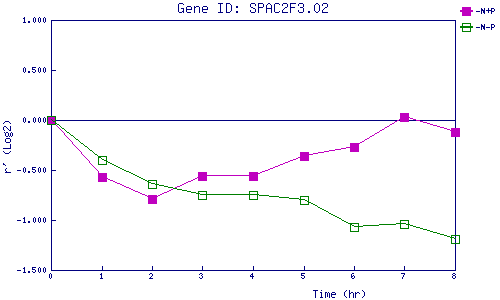
| 0 | 1 | 2 | 3 | 4 | 5 | 6 | 7 | 8 | |
| -N+P | 0.000 | -0.570 | -0.790 | -0.560 | -0.555 | -0.365 | -0.267 | 0.026 | -0.115 |
| -N-P | 0.000 | -0.400 | -0.643 | -0.750 | -0.753 | -0.799 | -1.067 | -1.035 | -1.192 |
|
-N+P: Nitrogen starved in the presence of P-factor -N-P: Nitrogen starved in the absence of P-factor |