rpa49
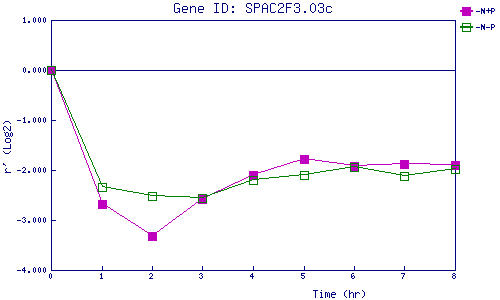
| 0 | 1 | 2 | 3 | 4 | 5 | 6 | 7 | 8 | |
| -N+P | 0.000 | -2.674 | -3.322 | -2.577 | -2.103 | -1.777 | -1.926 | -1.886 | -1.908 |
| -N-P | 0.000 | -2.343 | -2.530 | -2.553 | -2.205 | -2.107 | -1.941 | -2.118 | -1.972 |
|
-N+P: Nitrogen starved in the presence of P-factor -N-P: Nitrogen starved in the absence of P-factor |