| 0 | 1 | 2 | 3 | 4 | 5 | 6 | 7 | 8 | |
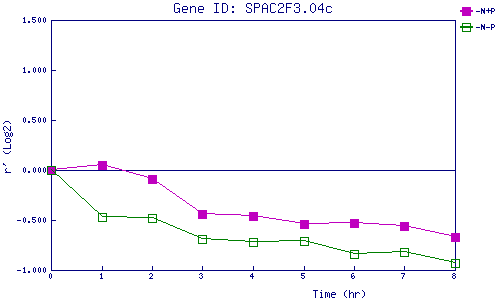
| -N+P | 0.000 | 0.053 | -0.091 | -0.437 | -0.464 | -0.541 | -0.530 | -0.558 | -0.666 |
| -N-P | 0.000 | -0.470 | -0.475 | -0.691 | -0.723 | -0.714 | -0.841 | -0.815 | -0.929 |
|
-N+P: Nitrogen starved in the presence of P-factor -N-P: Nitrogen starved in the absence of P-factor |