kap104
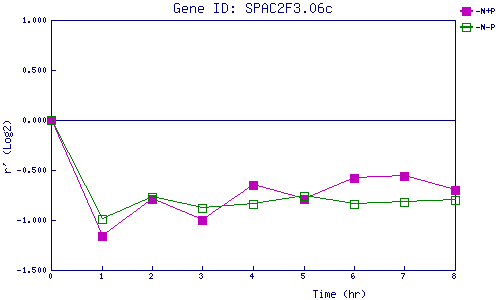
| 0 | 1 | 2 | 3 | 4 | 5 | 6 | 7 | 8 | |
| -N+P | 0.000 | -1.159 | -0.793 | -1.002 | -0.652 | -0.786 | -0.583 | -0.562 | -0.701 |
| -N-P | 0.000 | -0.992 | -0.768 | -0.882 | -0.842 | -0.757 | -0.836 | -0.825 | -0.800 |
|
-N+P: Nitrogen starved in the presence of P-factor -N-P: Nitrogen starved in the absence of P-factor |