| 0 | 1 | 2 | 3 | 4 | 5 | 6 | 7 | 8 | |
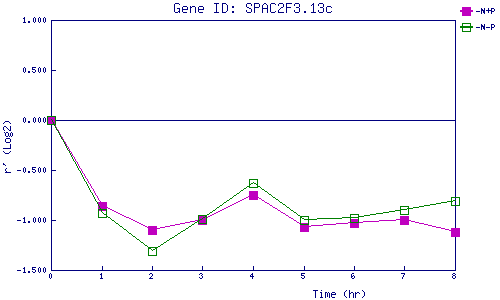
| -N+P | 0.000 | -0.861 | -1.097 | -1.000 | -0.754 | -1.067 | -1.032 | -1.005 | -1.116 |
| -N-P | 0.000 | -0.931 | -1.313 | -0.986 | -0.630 | -1.005 | -0.983 | -0.895 | -0.806 |
|
-N+P: Nitrogen starved in the presence of P-factor -N-P: Nitrogen starved in the absence of P-factor |