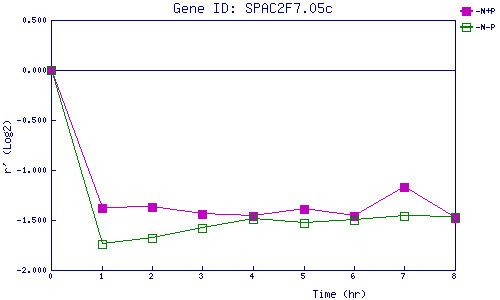
| 0 | 1 | 2 | 3 | 4 | 5 | 6 | 7 | 8 | |
| -N+P | 0.000 | -1.378 | -1.371 | -1.443 | -1.458 | -1.391 | -1.464 | -1.168 | -1.482 |
| -N-P | 0.000 | -1.737 | -1.679 | -1.584 | -1.491 | -1.530 | -1.505 | -1.458 | -1.471 |
|
-N+P: Nitrogen starved in the presence of P-factor -N-P: Nitrogen starved in the absence of P-factor |