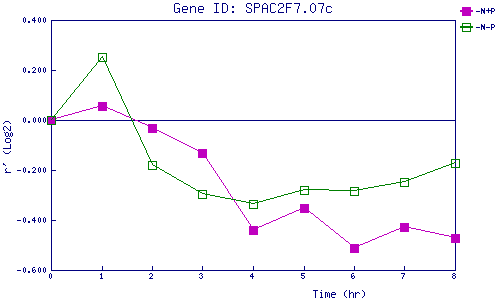
| 0 | 1 | 2 | 3 | 4 | 5 | 6 | 7 | 8 | |
| -N+P | 0.000 | 0.058 | -0.034 | -0.131 | -0.440 | -0.353 | -0.513 | -0.428 | -0.471 |
| -N-P | 0.000 | 0.251 | -0.180 | -0.298 | -0.338 | -0.278 | -0.284 | -0.248 | -0.172 |
|
-N+P: Nitrogen starved in the presence of P-factor -N-P: Nitrogen starved in the absence of P-factor |