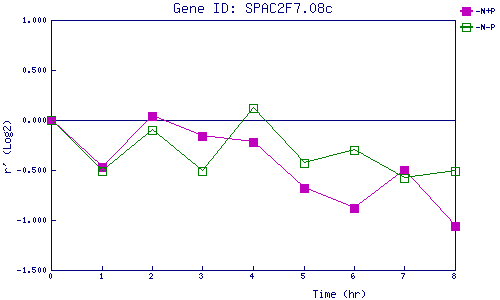
| 0 | 1 | 2 | 3 | 4 | 5 | 6 | 7 | 8 | |
| -N+P | 0.000 | -0.474 | 0.040 | -0.161 | -0.225 | -0.682 | -0.882 | -0.504 | -1.057 |
| -N-P | 0.000 | -0.506 | -0.101 | -0.514 | 0.122 | -0.431 | -0.296 | -0.578 | -0.508 |
|
-N+P: Nitrogen starved in the presence of P-factor -N-P: Nitrogen starved in the absence of P-factor |