nrd1
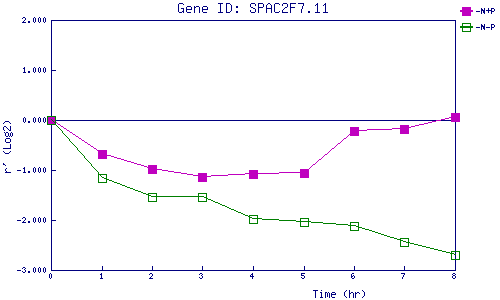
| 0 | 1 | 2 | 3 | 4 | 5 | 6 | 7 | 8 | |
| -N+P | 0.000 | -0.689 | -0.981 | -1.138 | -1.075 | -1.058 | -0.226 | -0.185 | 0.061 |
| -N-P | 0.000 | -1.164 | -1.536 | -1.539 | -1.983 | -2.036 | -2.117 | -2.432 | -2.709 |
|
-N+P: Nitrogen starved in the presence of P-factor -N-P: Nitrogen starved in the absence of P-factor |