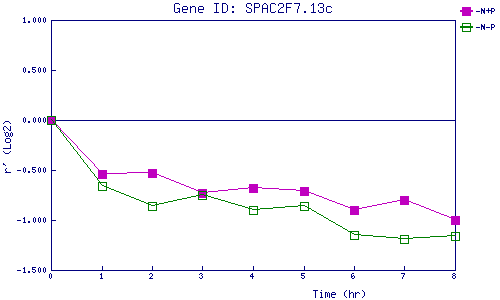
| 0 | 1 | 2 | 3 | 4 | 5 | 6 | 7 | 8 | |
| -N+P | 0.000 | -0.542 | -0.530 | -0.734 | -0.684 | -0.713 | -0.895 | -0.803 | -0.997 |
| -N-P | 0.000 | -0.658 | -0.864 | -0.746 | -0.900 | -0.862 | -1.151 | -1.187 | -1.160 |
|
-N+P: Nitrogen starved in the presence of P-factor -N-P: Nitrogen starved in the absence of P-factor |