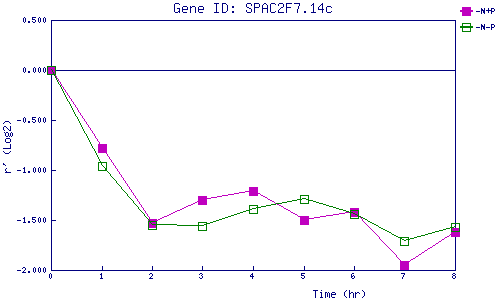
| 0 | 1 | 2 | 3 | 4 | 5 | 6 | 7 | 8 | |
| -N+P | 0.000 | -0.783 | -1.528 | -1.305 | -1.209 | -1.495 | -1.417 | -1.948 | -1.617 |
| -N-P | 0.000 | -0.961 | -1.554 | -1.563 | -1.389 | -1.292 | -1.444 | -1.706 | -1.571 |
|
-N+P: Nitrogen starved in the presence of P-factor -N-P: Nitrogen starved in the absence of P-factor |